
 Blog
Blog
How We Log Exceptions in Production Java Application Servers
Isolating exceptions in production environments is tough. Here's how we do it.
Jeff Fry
December 16, 2015

Jeff is a Senior Technical Marketing Engineer at ExtraHop.
One of the challenges of Java web application server development is catching and analyzing exceptions from your web application after deployment into a production environment. Whether your web application is deployed on Tomcat, Apache Geronimo, Glassfish or JBoss/Wildfly, analyzing exceptions, including exception logging in Java, involves digging through application server logs to isolate an issue.
Isolating an issue is even more difficult in a cluster of application servers. When your conventional monitoring tool reports HTTP 500 errors, where do you look? What caused the exception? What was the request URI? What else was going on? The investigation usually requires the time consuming task of piecing together data from multiple sources. What you need is centralized monitoring and analysis. Enter ExtraHop.
21-Mar-2015 15:24:57.521 SEVERE [http-nio-8080-exec-28] org.apache.catalina.core.StandardWrapperValve.invoke Servlet.service() for servlet [MyHttpServlet] in context with path [/HttpServletExceptionHandler] threw exception [CustomException] with root cause CustomException at MyHttpServlet.doGet(MyHttpServlet.java:20) at javax.servlet.http.HttpServlet.service(HttpServlet.java:618) at javax.servlet.http.HttpServlet.service(HttpServlet.java:725) at org.apache.catalina.core.ApplicationFilterChain.internalDoFilter(ApplicationFilterChain.java:291) at org.apache.catalina.core.ApplicationFilterChain.doFilter(ApplicationFilterChain.java:206) at org.apache.tomcat.websocket.server.WsFilter.doFilter(WsFilter.java:52)
Above is an example of a Tomcat exception log. Enough to solve the issue? Probably not.
Using the ExtraHop platform, we can capture the exceptions off the wire from all of our application servers, extract important details, and then gather all that data in a central location along with other related transactions. No agent software is installed! Let's walk through how we set this up.
Configuring the Error Page
Java web application servers allow the configuration of an error page when exceptions occur. We will configure this error page to contain the exception information, including exception logging in Java. Since the error page will be sent in a HTTP response, ExtraHop can pull the exception details off the wire.
To configure the error page from the web application, we add the appropriate XML tags to the web application web.xml.
500/WEB-INF/jsp/common/Error.jsp
This configures HTTP 500 errors to be presented by /WEB-INF/jsp/common/Error.jsp
Now let's take a look at Error.jsp.
<%@ page isErrorPage="true" import="java.io.*" contentType="text/html;charset=UTF-8"%> <%@ include file="../common/IncludeTop.jsp"%>

Oops! An error occurred!<%@ include file="../common/IncludeBottom.jsp"%>
The key to this error page is embedding the exception details so that we can use an ExtraHop trigger to grab these details off the wire. We wrap these lines between comment tags so that the web user does not see them.
This is what the actual page looks like to a web user when an error occurs. Notice that we don't see the exception, but it is there.
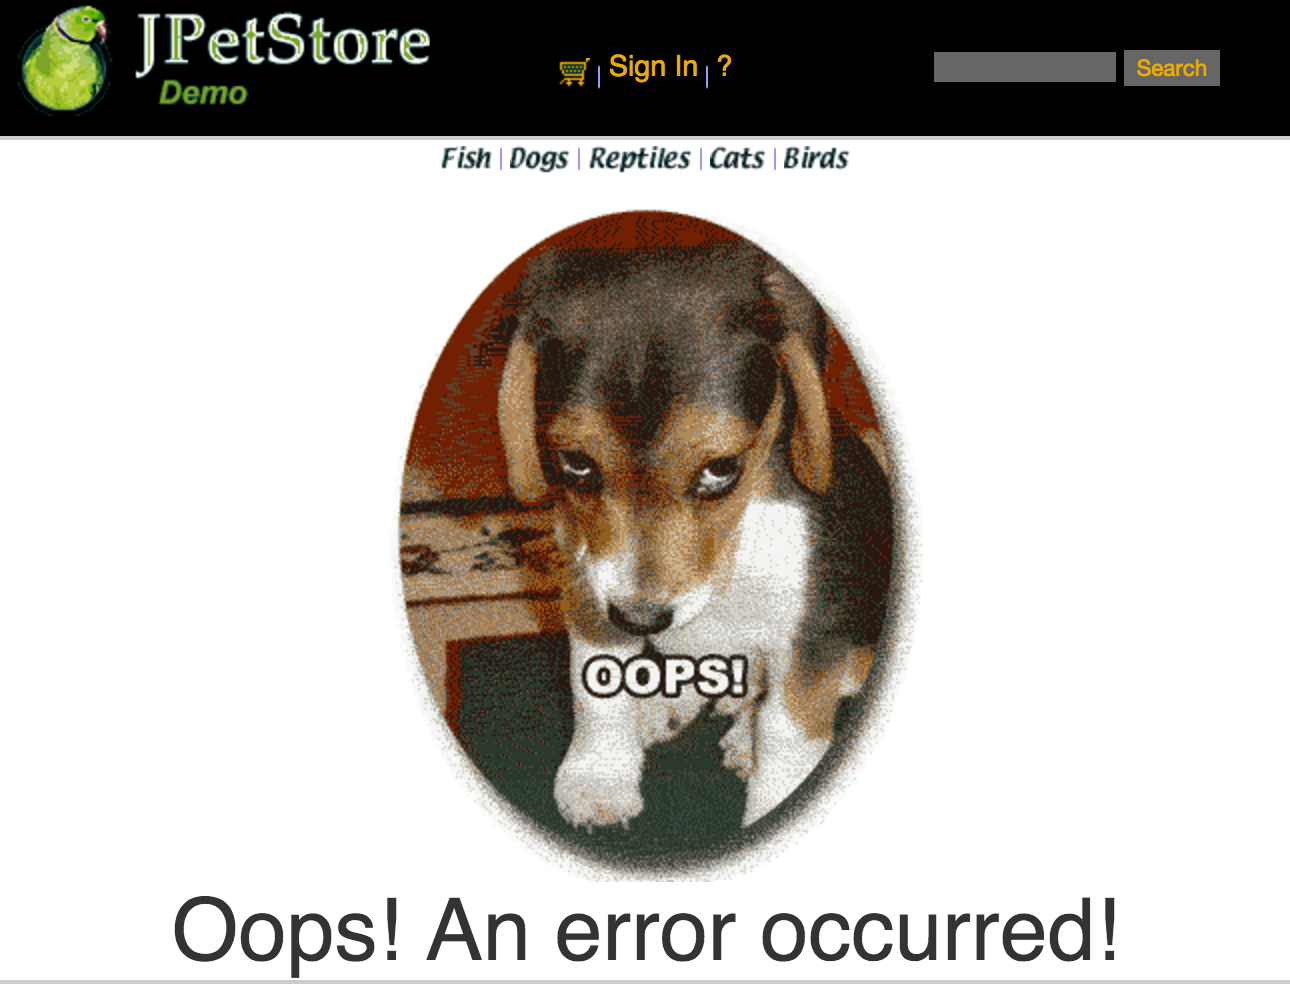
Sad 500-error puppy is sad.
Creating the ExtraHop Trigger
The ExtraHop platform allows you to create custom triggers, including exception logging in java, by using Javascript to process an abundant array of traffic types. For our purposes, we create a trigger that handles HTTP response traffic and HTTP 500 errors. We configure the trigger to respond to HTTP_RESPONSE events and we configure the HTTP payload buffer to be 10K bytes.
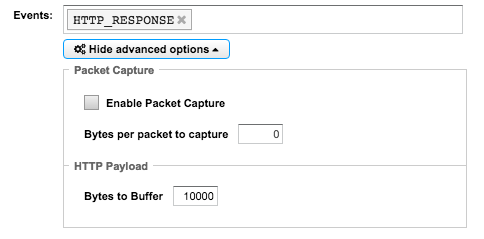
Trigger configuration in ExtraHop
Now let's take a look at the trigger code.
//only for 500 errors if(HTTP.statusCode==500){
//grab the HTTP payload var payloadString = HTTP.payload.toString(); //check to see if we have an exception var exceptionMsgIndex = payloadString.indexOf('Exception Message:'); if(exceptionMsgIndex>0){ //grab the exception message var exceptionMsgStart = payloadString.indexOf('{',exceptionMsgIndex)+1; var exceptionMsgEnd = payloadString.indexOf('}',exceptionMsgStart); if(exceptionMsgStart<0||exceptionMsgEnd<=exceptionMsgStart) return; var exceptionMsg = payloadString.substring(exceptionMsgStart,exceptionMsgEnd); //grab the stack trace var stackTraceIndex = payloadString.indexOf('Stack Trace:'); var stackTraceStart = payloadString.indexOf('{',stackTraceIndex)+1; var stackTraceEnd = payloadString.indexOf('}',stackTraceStart); if(stackTraceStart<0||stackTraceEnd<=stackTraceStart) return; var stackTrace = payloadString.substring(stackTraceStart,stackTraceEnd); //grab the root cause from the stack trace var rootCauseIndex = stackTrace.lastIndexOf('Caused by'); var rootCauseStart = stackTrace.indexOf(':',rootCauseIndex)+1; var rootCauseEnd = stackTrace.indexOf('<p>',rootCauseStart); if(rootCauseStart<0||rootCauseEnd<=rootCauseStart) return; var rootCause = stackTrace.substring(rootCauseStart,rootCauseEnd); //create a custom metric Network.metricAddDetailCount('HTTP Error Message',rootCause,1) //commit the custom record for the exception commitRecord('httpErrorsDetail',{'server':Flow.server,'serverAddr':Flow.server.ipaddr,'method':HTTP.method,'statusCode':HTTP.statusCode,'uri':HTTP.uri,'exceptionMsg':exceptionMsg,'rootCause':rootCause,'stackTrace':stackTrace}); }
}
We set up the trigger to only handle HTTP 500 errors with the if statement. From there, we extract the exception details as presented in the Error.jsp page from the HTTP payload. We grab the exception message, the stack trace, and the root cause from the stack trace. Finally, we store the data in two ways. First, we create a custom metric, HTTP Error Message, to count the various number of exception root causes we encounter. Second, we store the data as a transaction with the commitRecord call.
Exception Viewing and Analysis in ExtraHop
The custom metric, HTTP Error Message, allows us to display the error message counts in our ExtraHop dashboard, including those related to exception logging in Java. This aggregates the counts across all of our application servers. Now we can understand how frequently these exceptions occur.
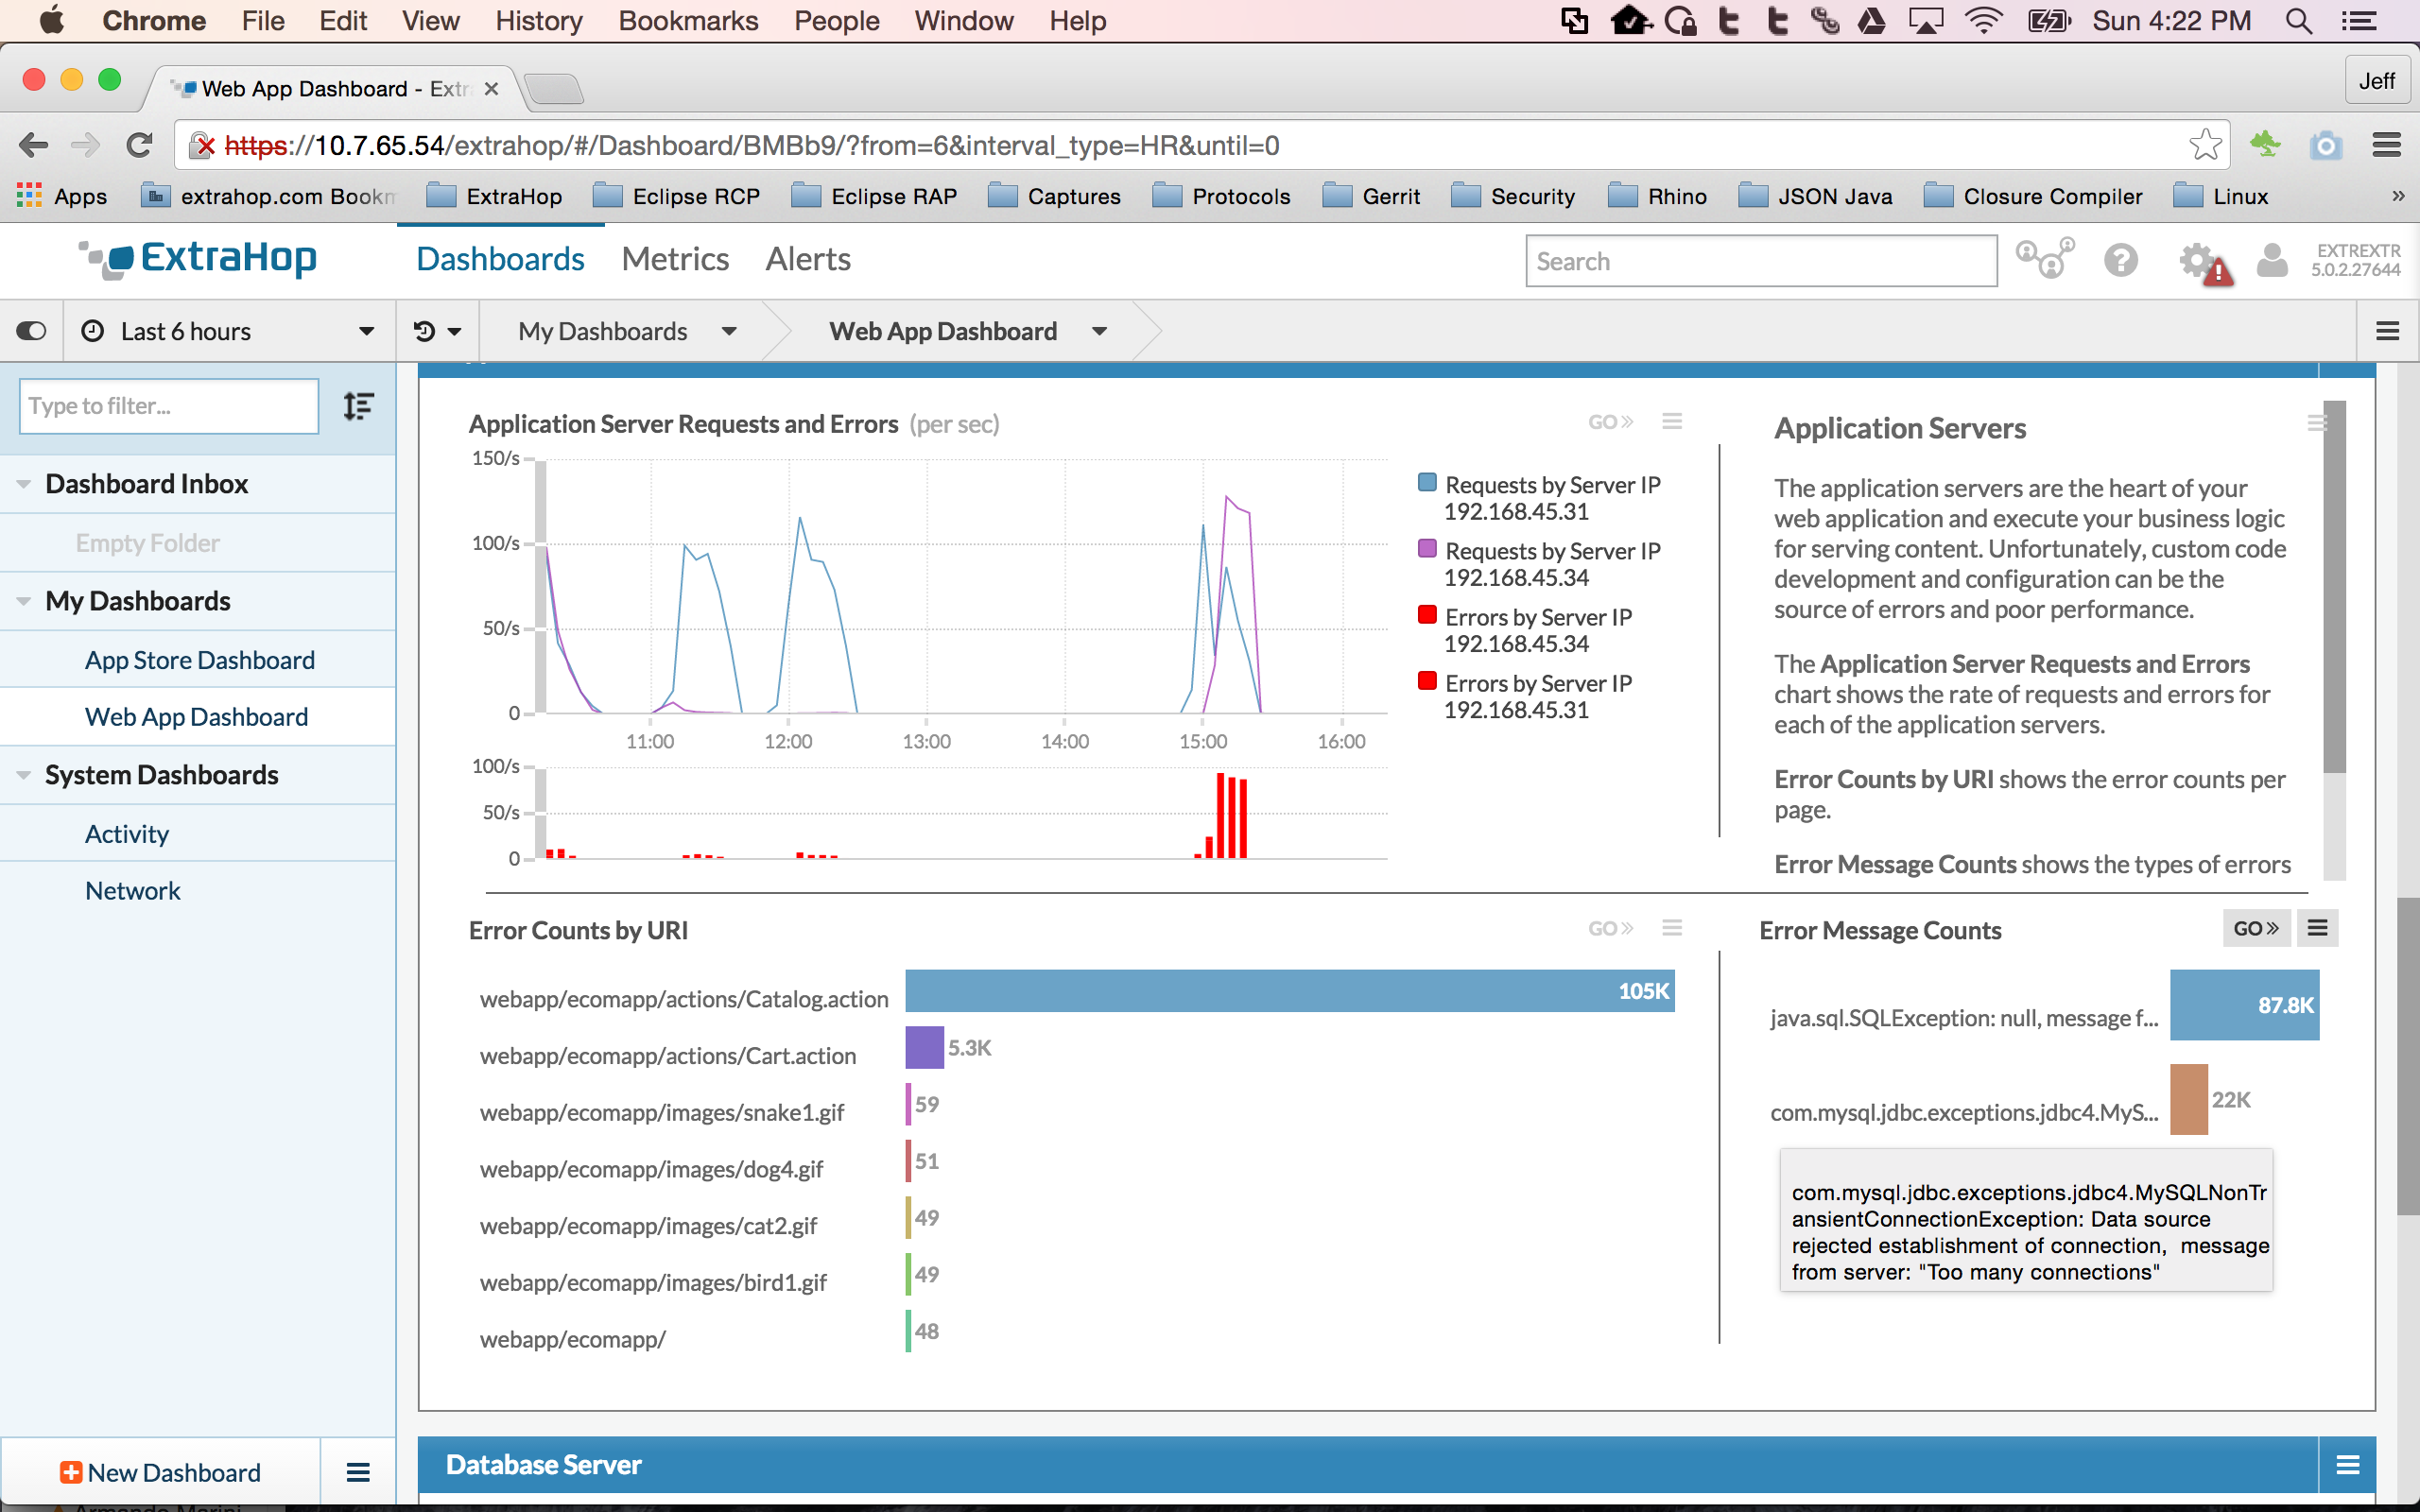
Error message counts for exceptions in a custom ExtraHop dashboard.
The commitRecord call in our trigger allows us to store the exception details that we extracted from our error page as a transaction. With the new ExtraHop Explore appliance, we can view these transactions alongside other related transactions.
Exception transaction records shown in the ExtraHop Explore appliance
In this example, we encountered exceptions related to database issues. We are able to view the database transactions alongside the exception transactions that we created. The database transactions were similarly captured off the wire between the application server and the database server.
Through the use of the ExtraHop platform and a minor code change in our web application, we are now able to collect exception details from all of our servers. Gone are the days of manually gathering logs from several application servers. We are able to view aggregate metrics as well as transaction level details all in one place. This greatly simplifies exception debugging in a production environment.
Discover more